ΕΦΑΡΜΟΓΗ ΜΕΤΡΗΣΗΣ ΚΑΙ ΔΙΑΧΕΙΡΙΣΗΣ ΔΗΜΟΤΙΚΩΝ ΕΚΠΟΜΠΩΝ
Ένα Σύστημα Υποστήριξης Αποφάσεων για τον υπολογισμό των εκπομπών των Δήμων και τη διαμόρφωση των κατάλληλων σχεδίων μείωσής τους, σύμφωνα με την Ελληνική νομοθεσία.
ΕΝΑ ΣΥΣΤΗΜΑ ΥΠΟΛΟΓΙΣΜΟΥ ΕΚΠΟΜΠΩΝ ΚΑΙ ΥΠΟΣΤΗΡΙΞΗΣ ΔηΣΜΕ ΓΙΑ ΤΟΥΣ ΕΛΛΗΝΙΚΟΥΣ ΔΗΜΟΥΣ
Ο όρος ESG (Environmental, Social, Governance) χρησιμοποιείται για την αξιολόγηση των επιχειρηματικών πρακτικών και της απόδοσης ενός οργανισμού σε διάφορα ζητήματα βιωσιμότητας.. Για να υποστηρίξει τους οργανισμούς, τις επιχειρήσεις και τις βιομηχανίες να εφαρμόσουν αυτό το πλαίσιο, η DRAXIS σχεδίασε μια ολοκληρωμένη σουίτα εφαρμογών, την ESG.
Η πρώτη εφαρμογή της σουίτας ESG Suite είναι η Εφαρμογή Δημοτικών Εκπομπών, η οποία έχει συν-σχεδιαστεί με τους περιβαλλοντικούς συμβούλους της Envirometrics, για να διευκολύνει την εφαρμογή της υπάρχουσας ελληνικής νομοθεσίας (Δημοτικό Σχέδιο Μείωσης Εκπομπών – ΔηΣΜΕ) ως προς τον υπολογισμό και τη διαμόρφωση του σχεδίου μείωσηςεκπομπών για τους Ελληνικούς Δήμους.
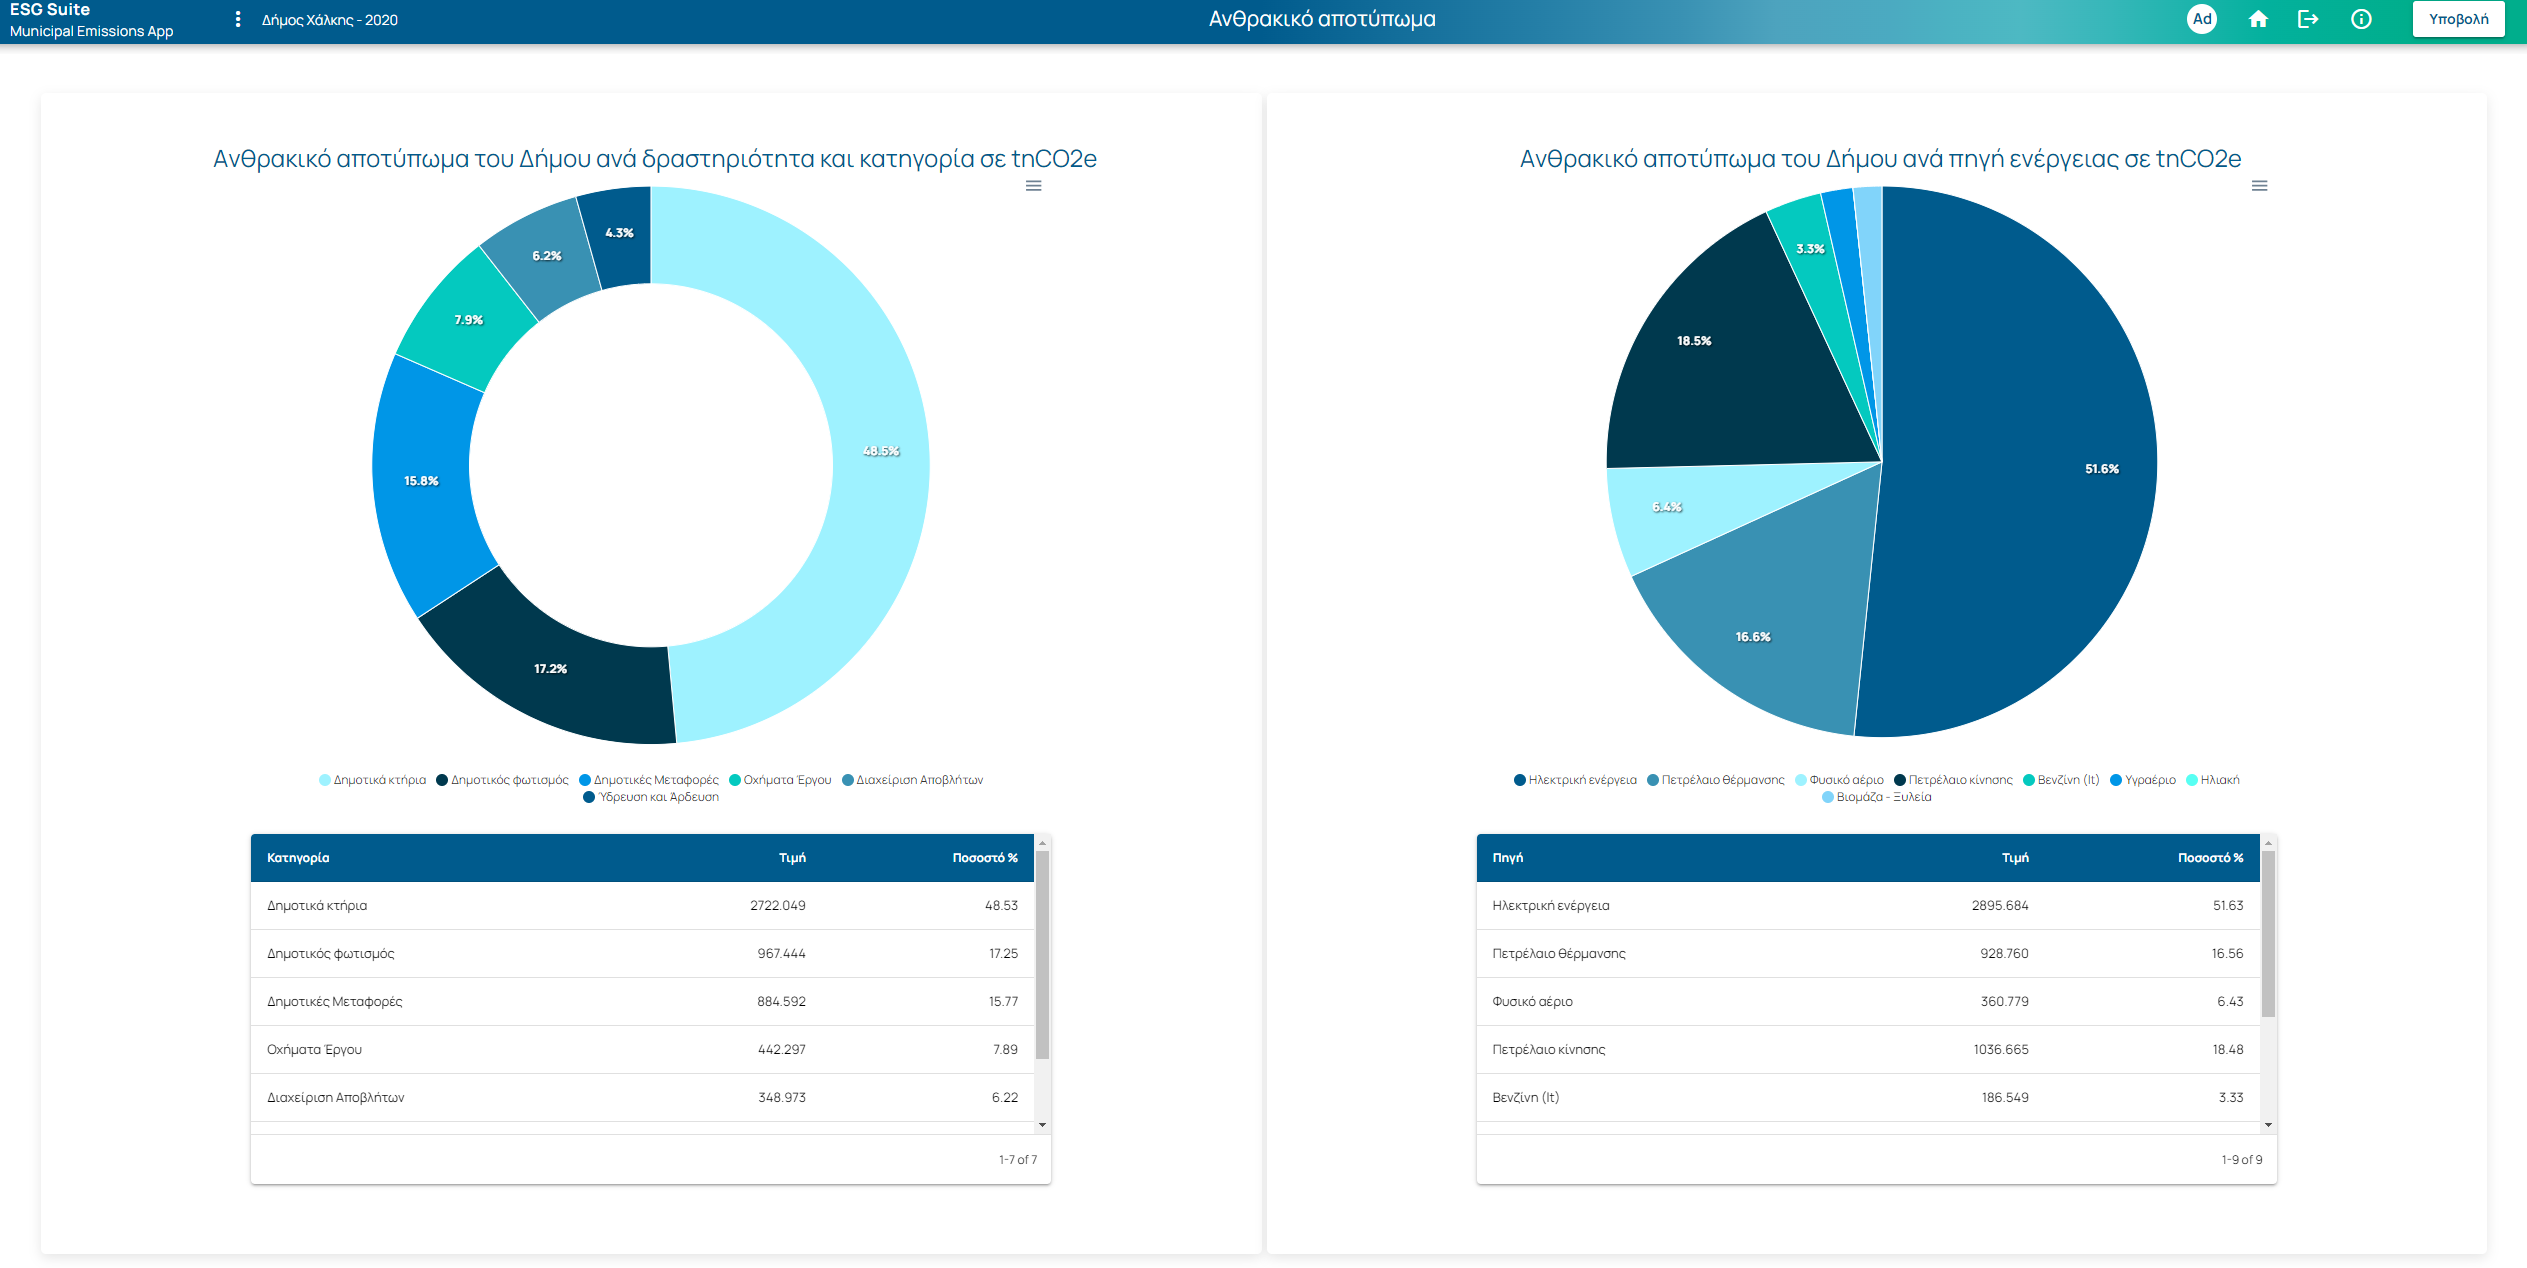
The main ESG Municipal Emissions’ dashboard.
ΘΕΤΟΝΤΑΣ ΤΗ ΝΟΜΟΘΕΣΙΑ ΜΕΙΩΣΗΣ ΕΚΠΟΜΠΩΝ ΣΕ ΕΦΑΡΜΟΓΗ
“GR National Climatic Law: All Municipalities must reduce the CO2 emissions 10% by 2025 and 30% by 2030”
ΕΙΣΑΓΩΓΗ ΔΕΔΟΜΕΝΩΝ
Φιλικό περιβάλλον για την εισαγωγή δεδομένων.
πίνακες οργάνων
Αναλυτικά dashboards για την οπτικοποίηση των αποτελεσμάτων και των αναλύσεων.
ΥΠΟΛΟΓΙΣΤΙΚΑ ΜΟΝΤΕΛΑ
Αυτοματοποιημένα μοντέλα που υπολογίζουν όλους τους δείκτες και τις μετρήσεις που αφορούν τις εκπομπές.
ΣΥΣΤΗΜΑ ΥΠΟΣΤΗΡΙΞΗΣ ΑΠΟΦΑΣΕΩΝ
Αξιολόγηση των δράσεων μείωσης των εκπομπών, σύμφωνα με τα προβλεπόμενα και τα πραγματικά αποτελέσματα.
ΕΝΔΕΙΚΤΙΚΗ ΛΙΣΤΑ ΛΕΙΤΟΥΡΓΙΩΝ ΠΟΥ ΠΡΟΣΦΕΡΕΙ Η ΕΦΑΡΜΟΓΗ ESG
- Εισαγωγή δεδομένων κατανάλωσης ενέργειας Δήμων
- Αυτόματοι υπολογισμοί σύμφωνα με τα πρόσφατα επιστημονικά και νομοθετικά δεδομένα
- Αναλυτικά dashboards που οπτικοποιούν τα αποτελέσματα με βάση τις ανάγκες του κάθε Δήμου για την κατάρτιση του σχεδίου μείωσης
- Υπολογισμός αβεβαιότητας εκπομπών
- Επιλογή δράσεων για τη μείωση των εκπομπών σε συνδυασμό με συγκριτική ανάλυση των προβλέψεων έναντι των πραγματικών εκπομπών και εκτέλεση σεναρίων “what-if”
ΠΡΟΗΓΜΕΝΑ DASHBOARDS
Το σύστημα παρέχει αναλυτικούς και ποικίλους πίνακες εργαλείων για την απεικόνιση όλων των αποτελεσμάτων υπολογισμού, ομαδοποιημένα στα ακόλουθα:
Ενεργειακή Ισορροπία
Αποτύπωμα Άνθρακα
Εκπομπές Αερίων του Θερμοκηπίου
Τα dashboards σχεδιάστηκαν και απεικονίζουν την πληροφορία, όπως θα πρέπει να παρουσιάζεται στην τελική έκθεση ΔηΣΜΕ που υποβάλλον οι Δήμοι.

ΣΥΣΤΗΜΑ ΛΗΨΗΣ ΑΠΟΦΑΣΕΩΝ
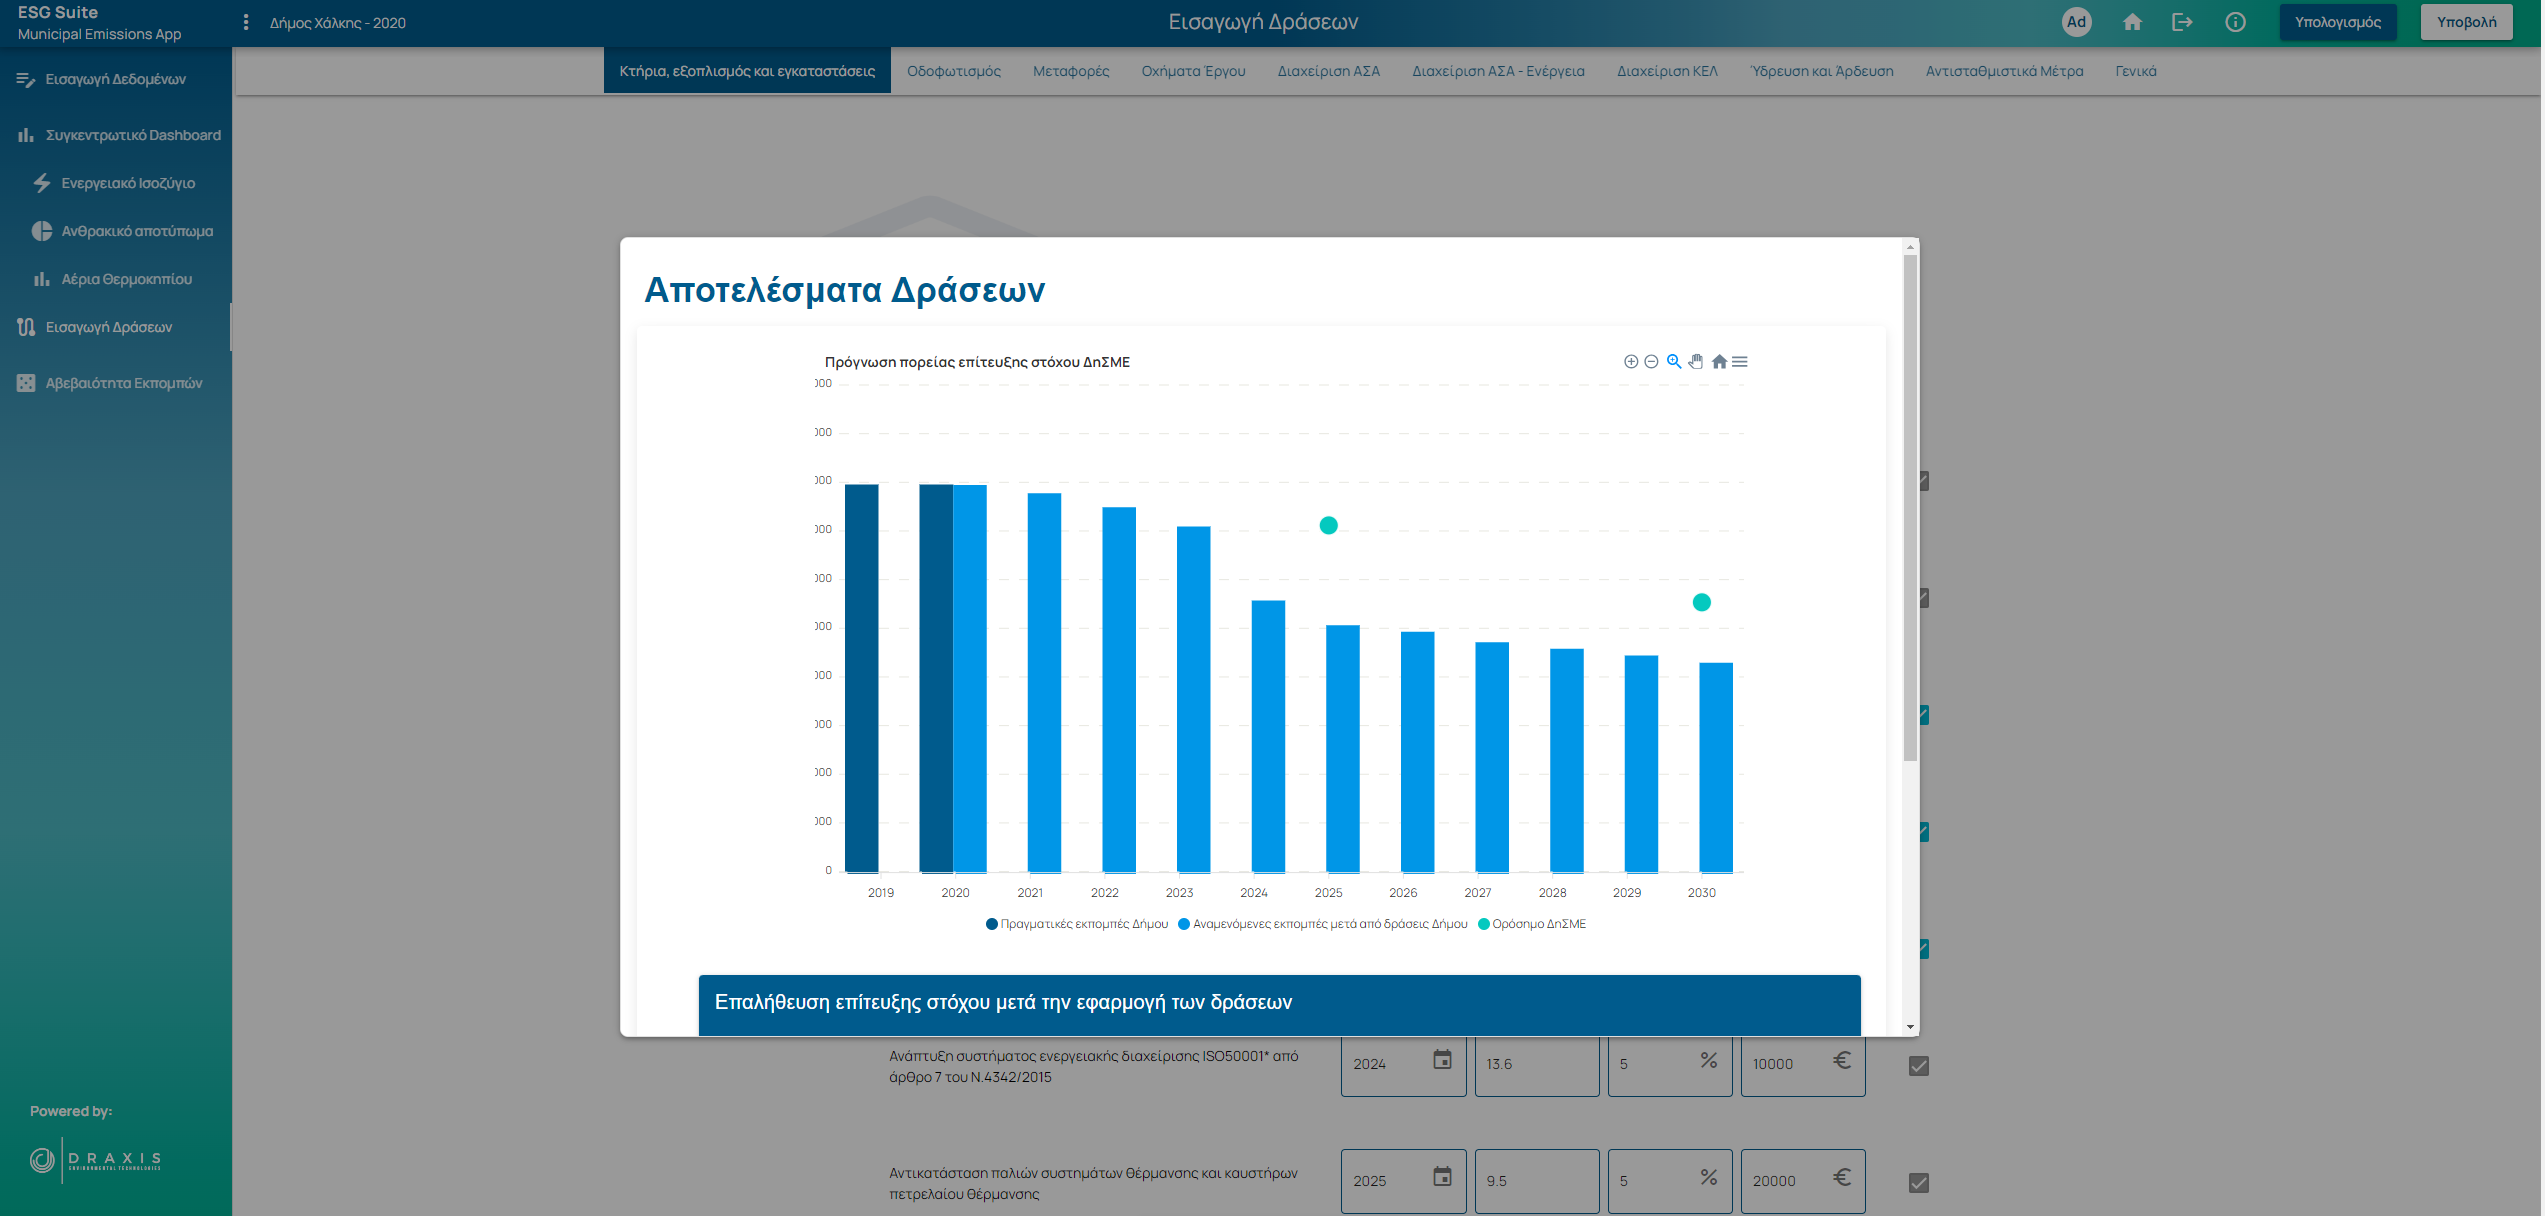
Η εφαρμογή παρέχει ένα σχέδιο δράσης πλήρους κλίμακας για τη μείωση των εκπομπών, το οποίο παρουσιάζει τα αναμενόμενα αποτελέσματα, επιτρέπει την παρακολούθηση των ενεργειών που πραγματοποιούνται και εκτελεί σενάρια “what-if' με βάση τα προσδοκώμενα αποτελέσματα.
Η εφαρμογή παρέχει αναλυτική παρουσίαση των προβλεπόμενων έναντι των πραγματικών εκπομπών και επαναξιολογεί τις ενέργειες σύμφωνα με τα αποτελέσματα και οικονομικούς δείκτες -KPI.
